
The last two weeks of December are unlike almost any time of year in terms of market movement and what we should read into it, but there were several housing-related reports that are worth considering as we head into the new year.
The National Association of Homebuilders (NAHB) published its builder confidence numbers on Monday. Overall confidence (aka “headline”) dropped for the 12th straight month to nearly the lowest level in more than a decade. There was a small glimmer of hope in the 6-month outlook which moved higher from last month and rose above headline confidence index for the first time all year. The more we see developments like this in the data, the more it would speak to a bottoming-out process for housing market weakness.

Other housing-related data conveyed mixed signals as well. A day later, the government’s New Residential Construction report showed a resilience in housing starts (the ground-breaking phase of construction) juxtaposed with a sharp decline in new building permits.

There are many layers of complexity underlying those numbers, and there are different conclusions to be gleaned depending on perception. In the shorter term, there’s no doubt the housing correction has been swift. But in the bigger picture, one might consider this correction to be payback for the uncanny boom of the past 2 years. After all, housing starts are still running well above roughly a decade of the pre-covid years.
Speaking of things depending on perception, let’s compare two other housing reports that came out this week: New vs Existing Home Sales.
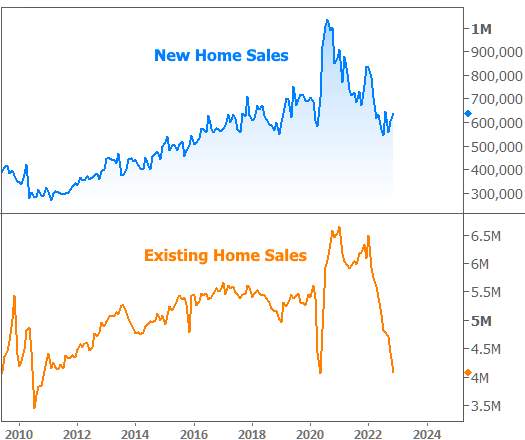
At first glance, it looks like new home sales are holding up quite well whereas existing home sales have fallen off a cliff. That’s actually not entirely untrue. Builders are eager to sell new homes whereas homeowners are extremely hesitant to sell their existing homes (thus giving up their lower mortgage rate and being faced with the prospect of higher prices and higher rates on their next home). That hesitation is apparent in the extremely low inventory levels of existing homes (notably very different than the financial crisis when inventory exploded).
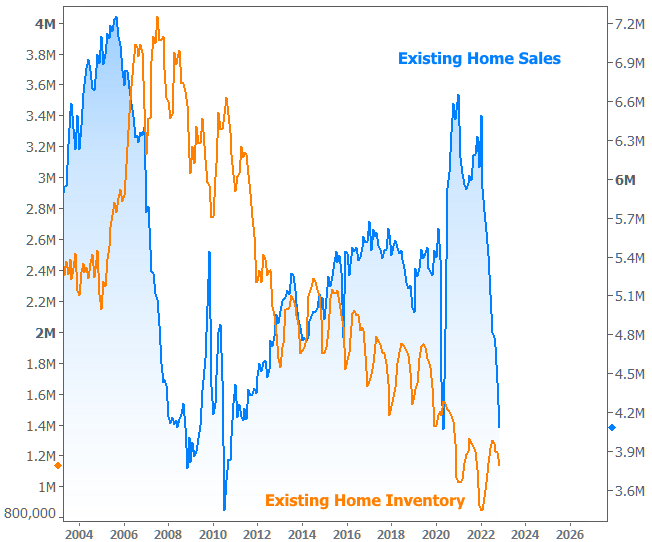
The other factor that allows such a disparate performance in New vs Existing homes is the relative size of the two markets. Here’s how the exact same numbers look when charted on the same axis.

In other words, new home sales are so small by comparison that the discrepancy isn’t as hard to reconcile. It doesn’t take too much success on the part of a few big homebuilders to cause some resilience in the blue line.
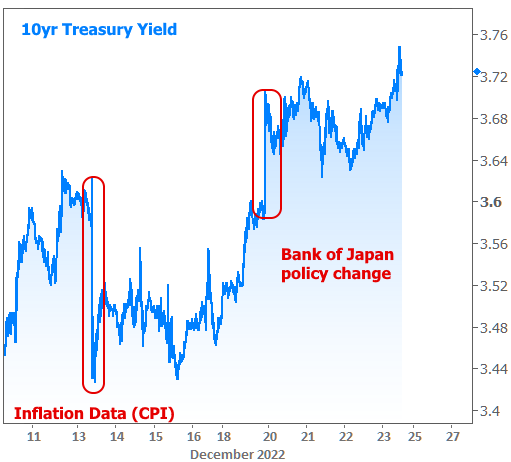
Shifting gears to financial markets, we see a similar phenomenon during the last two weeks of December. Trading activity winds down in such a way that each trader left in the office has a bigger impact on trading levels than they would during a busier time of year. This played out on Tuesday when the bond market reacted to an unexpected policy change from the Bank of Japan.
The chart below shows 10yr Treasury yields (a benchmark for all longer term rates in the US) losing nearly as much as they’d gained after last week’s inflation report. On any other week of the year, it would be unfathomable to see foreign central bank policy affect rates in the US as much as a hotly anticipated CPI report.
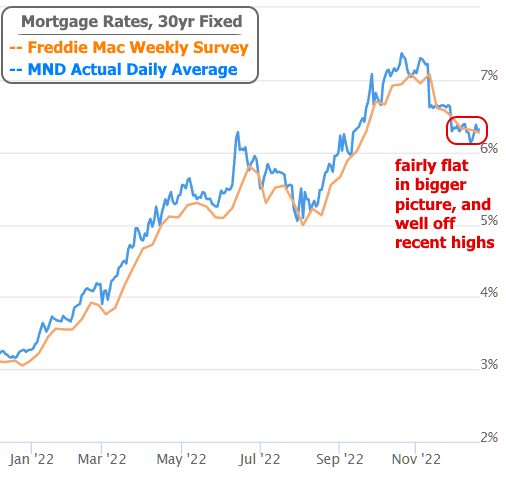
Thankfully, the volatility in the chart above represents only a small cross-section of the roads we’ve recently traveled. That’s even more apparent for mortgage rates. True, the average lender raised rates fairly quickly to start the week, but after offsetting that move with last week’s improvements, December looks somewhat flat in the bigger picture and still much lower than the recent highs.
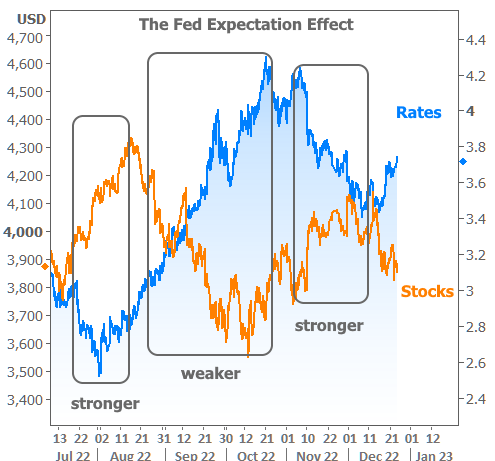
Heading into the new year, markets will continue to focus on economic data that speaks to the Federal Reserve’s policy outlook. Inflation data is the most important in this regard, but other economic indicators shouldn’t be ignored. In general, higher inflation and stronger economic growth is bad for both stocks and bonds. Vice versa for cooler inflation and a cooling economy.
The Fed expectation effect is readily apparent in charts with stock prices and bond yields (aka “rates”) tending to move in opposite directions depending on what the data suggests the Fed will do. Both improved in July when data faltered. Then stocks tumbled while rates spiked heading into the fall months due to resilience in economic data and upside surprises in inflation. The last two months of cooler inflation data have been the key drivers behind the Nov/Dec recovery.
NOTE: the Federal holiday for Christmas occurs on Monday the 26th this year. Markets and most mortgage lenders will be closed.